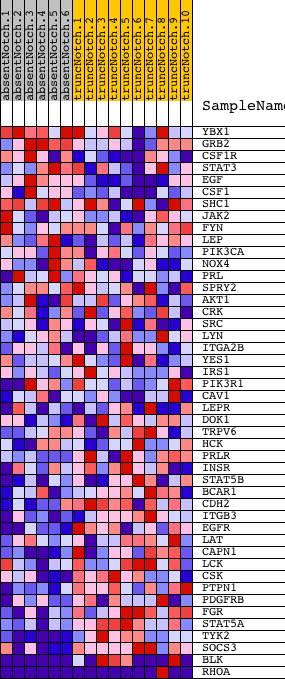
Profile of the Running ES Score & Positions of GeneSet Members on the Rank Ordered List
| Dataset | Set_03_absentNotch_versus_truncNotch.phenotype_absentNotch_versus_truncNotch.cls #absentNotch_versus_truncNotch.phenotype_absentNotch_versus_truncNotch.cls #absentNotch_versus_truncNotch_repos |
| Phenotype | phenotype_absentNotch_versus_truncNotch.cls#absentNotch_versus_truncNotch_repos |
| Upregulated in class | truncNotch |
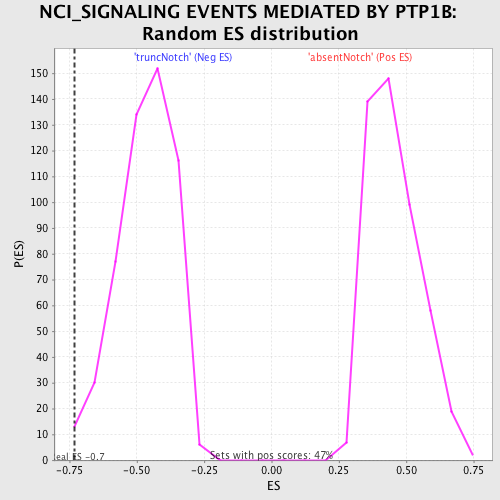
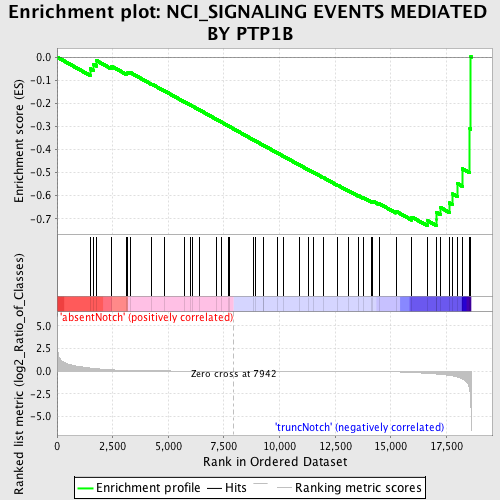
| GeneSet | NCI_SIGNALING EVENTS MEDIATED BY PTP1B |
| Enrichment Score (ES) | -0.7311436 |
| Normalized Enrichment Score (NES) | -1.5721345 |
| Nominal p-value | 0.009469697 |
| FDR q-value | 0.31158233 |
| FWER p-Value | 0.867 |
| PROBE | DESCRIPTION (from dataset) | GENE SYMBOL | GENE_TITLE | RANK IN GENE LIST | RANK METRIC SCORE | RUNNING ES | CORE ENRICHMENT | |
|---|---|---|---|---|---|---|---|---|
| 1 | YBX1 | 1340039 4730500 | 1489 | 0.338 | -0.0501 | No | ||
| 2 | GRB2 | 6650398 | 1627 | 0.299 | -0.0309 | No | ||
| 3 | CSF1R | 2340110 6420408 | 1778 | 0.263 | -0.0156 | No | ||
| 4 | STAT3 | 460040 3710341 | 2434 | 0.137 | -0.0387 | No | ||
| 5 | EGF | 5220154 | 3128 | 0.071 | -0.0697 | No | ||
| 6 | CSF1 | 3120400 | 3179 | 0.068 | -0.0664 | No | ||
| 7 | SHC1 | 2900731 3170504 6520537 | 3308 | 0.060 | -0.0679 | No | ||
| 8 | JAK2 | 3780528 6100692 6550577 | 4259 | 0.022 | -0.1171 | No | ||
| 9 | FYN | 2100468 4760520 4850687 | 4821 | 0.014 | -0.1462 | No | ||
| 10 | LEP | 4010053 | 5717 | 0.007 | -0.1937 | No | ||
| 11 | PIK3CA | 6220129 | 5975 | 0.006 | -0.2070 | No | ||
| 12 | NOX4 | 6040136 | 6099 | 0.006 | -0.2131 | No | ||
| 13 | PRL | 3440435 | 6411 | 0.004 | -0.2295 | No | ||
| 14 | SPRY2 | 5860184 | 7170 | 0.002 | -0.2701 | No | ||
| 15 | AKT1 | 5290746 | 7384 | 0.001 | -0.2815 | No | ||
| 16 | CRK | 1230162 4780128 | 7696 | 0.001 | -0.2982 | No | ||
| 17 | SRC | 580132 | 7739 | 0.001 | -0.3004 | No | ||
| 18 | LYN | 6040600 | 8811 | -0.002 | -0.3579 | No | ||
| 19 | ITGA2B | 2680538 | 8938 | -0.002 | -0.3644 | No | ||
| 20 | YES1 | 6100050 | 9268 | -0.003 | -0.3818 | No | ||
| 21 | IRS1 | 1190204 | 9285 | -0.003 | -0.3824 | No | ||
| 22 | PIK3R1 | 4730671 | 9923 | -0.005 | -0.4162 | No | ||
| 23 | CAV1 | 870025 | 10197 | -0.006 | -0.4304 | No | ||
| 24 | LEPR | 1340398 3190324 | 10879 | -0.008 | -0.4663 | No | ||
| 25 | DOK1 | 1050279 2680112 5220273 | 11313 | -0.010 | -0.4887 | No | ||
| 26 | TRPV6 | 4010717 | 11544 | -0.011 | -0.5001 | No | ||
| 27 | HCK | 4230592 | 11976 | -0.014 | -0.5221 | No | ||
| 28 | PRLR | 1980647 1990097 | 12598 | -0.019 | -0.5539 | No | ||
| 29 | INSR | 1190504 | 13090 | -0.024 | -0.5782 | No | ||
| 30 | STAT5B | 6200026 | 13568 | -0.031 | -0.6011 | No | ||
| 31 | BCAR1 | 1340215 | 13770 | -0.035 | -0.6088 | No | ||
| 32 | CDH2 | 520435 2450451 2760025 6650477 | 14128 | -0.042 | -0.6243 | No | ||
| 33 | ITGB3 | 5270463 | 14194 | -0.044 | -0.6239 | No | ||
| 34 | EGFR | 4920138 6480521 | 14489 | -0.052 | -0.6351 | No | ||
| 35 | LAT | 3170025 | 15232 | -0.084 | -0.6675 | No | ||
| 36 | CAPN1 | 6660300 | 15940 | -0.149 | -0.6924 | No | ||
| 37 | LCK | 3360142 | 16661 | -0.250 | -0.7089 | Yes | ||
| 38 | CSK | 6350593 | 17046 | -0.318 | -0.7013 | Yes | ||
| 39 | PTPN1 | 2650056 | 17049 | -0.318 | -0.6732 | Yes | ||
| 40 | PDGFRB | 6450279 | 17242 | -0.356 | -0.6518 | Yes | ||
| 41 | FGR | 3780047 | 17639 | -0.470 | -0.6313 | Yes | ||
| 42 | STAT5A | 2680458 | 17785 | -0.525 | -0.5924 | Yes | ||
| 43 | TYK2 | 1660465 1740736 | 17987 | -0.631 | -0.5471 | Yes | ||
| 44 | SOCS3 | 5550563 | 18214 | -0.851 | -0.4836 | Yes | ||
| 45 | BLK | 1940128 5390053 | 18553 | -2.150 | -0.3106 | Yes | ||
| 46 | RHOA | 580142 5900131 5340450 | 18598 | -3.530 | 0.0010 | Yes |